Table 1:
Prevalence rates of mental health problems reported by surveys conducted between 1988 and 2003.
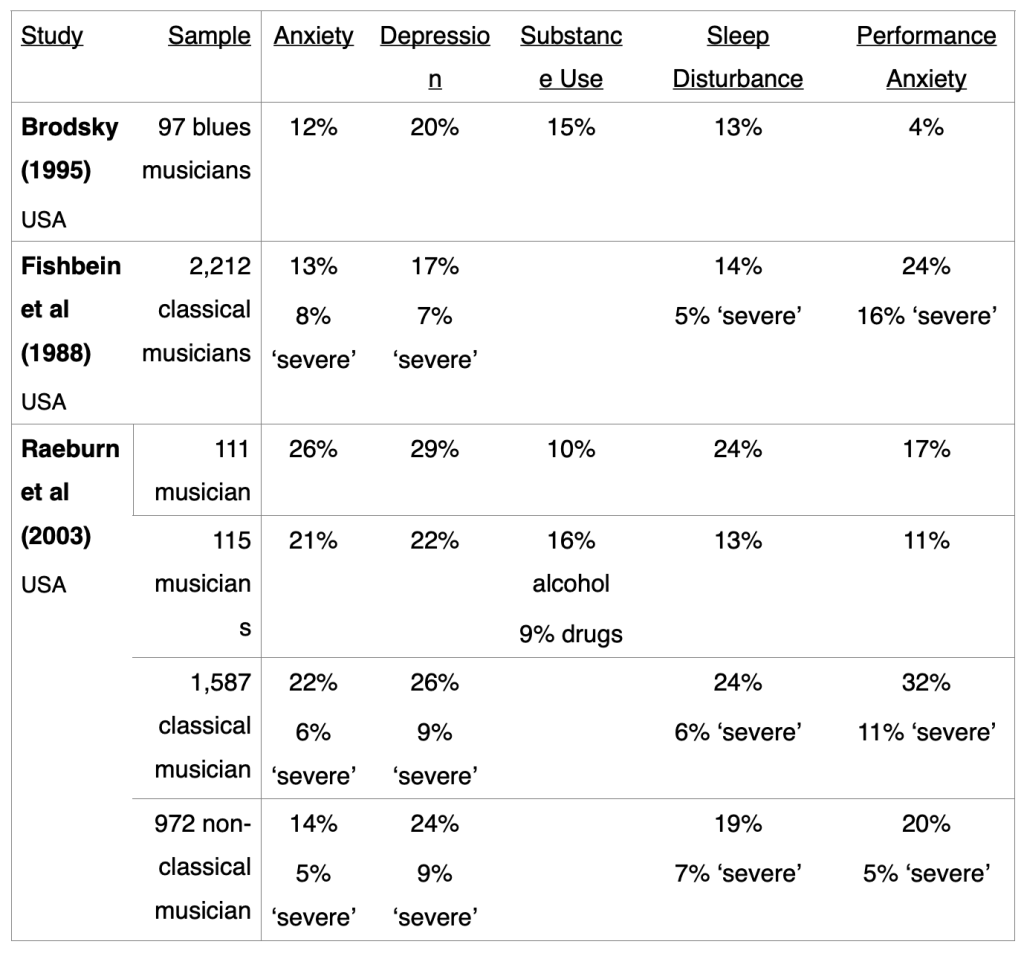
Table 2
Prevalence rates of mental health problems reported by surveys conducted since 2012.
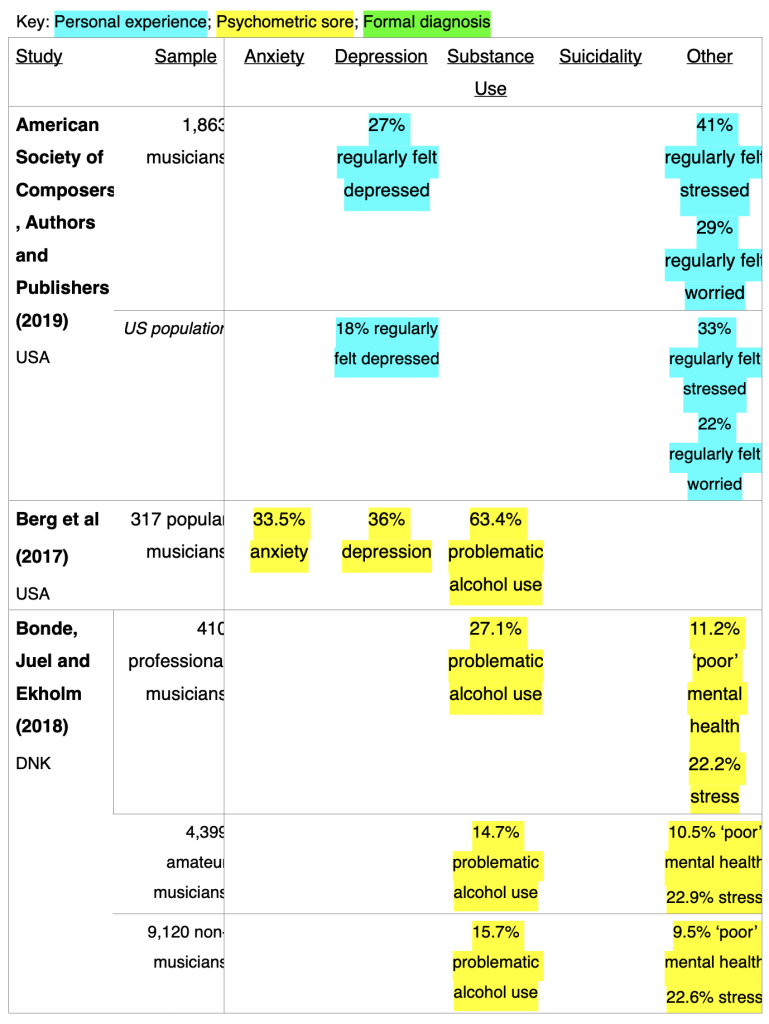
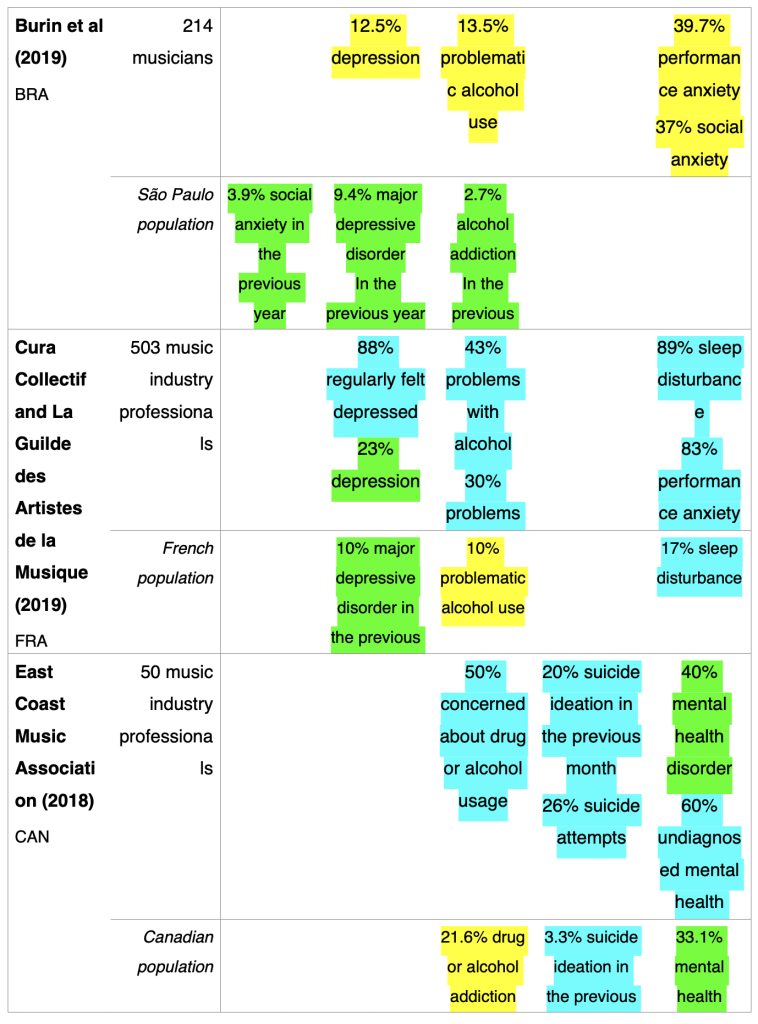
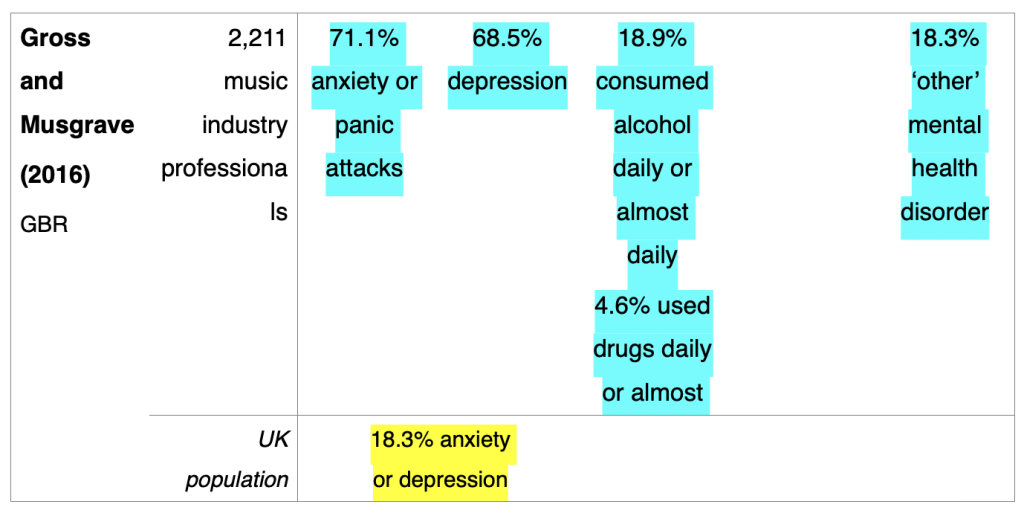
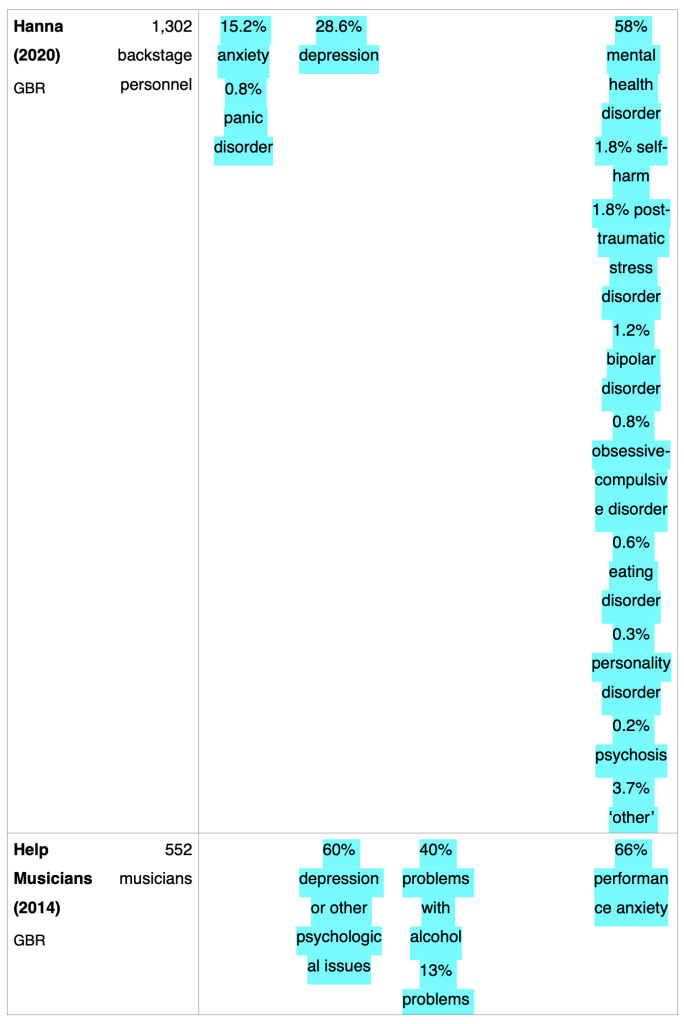
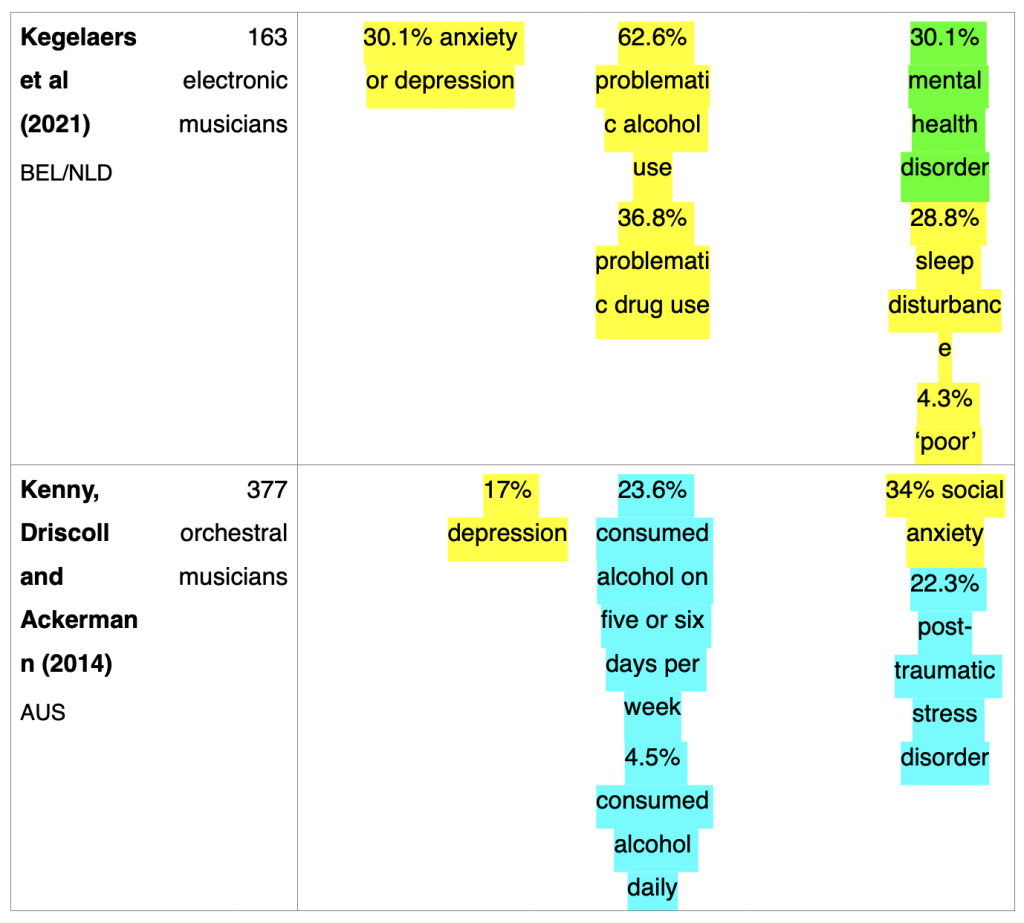
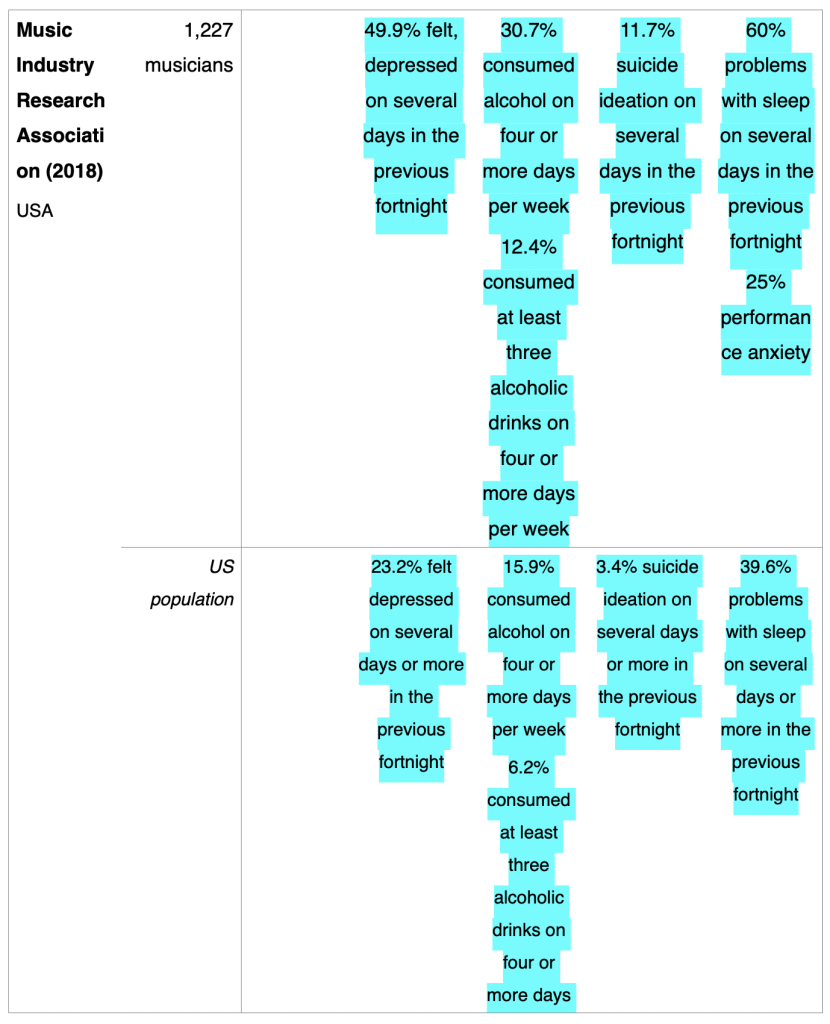
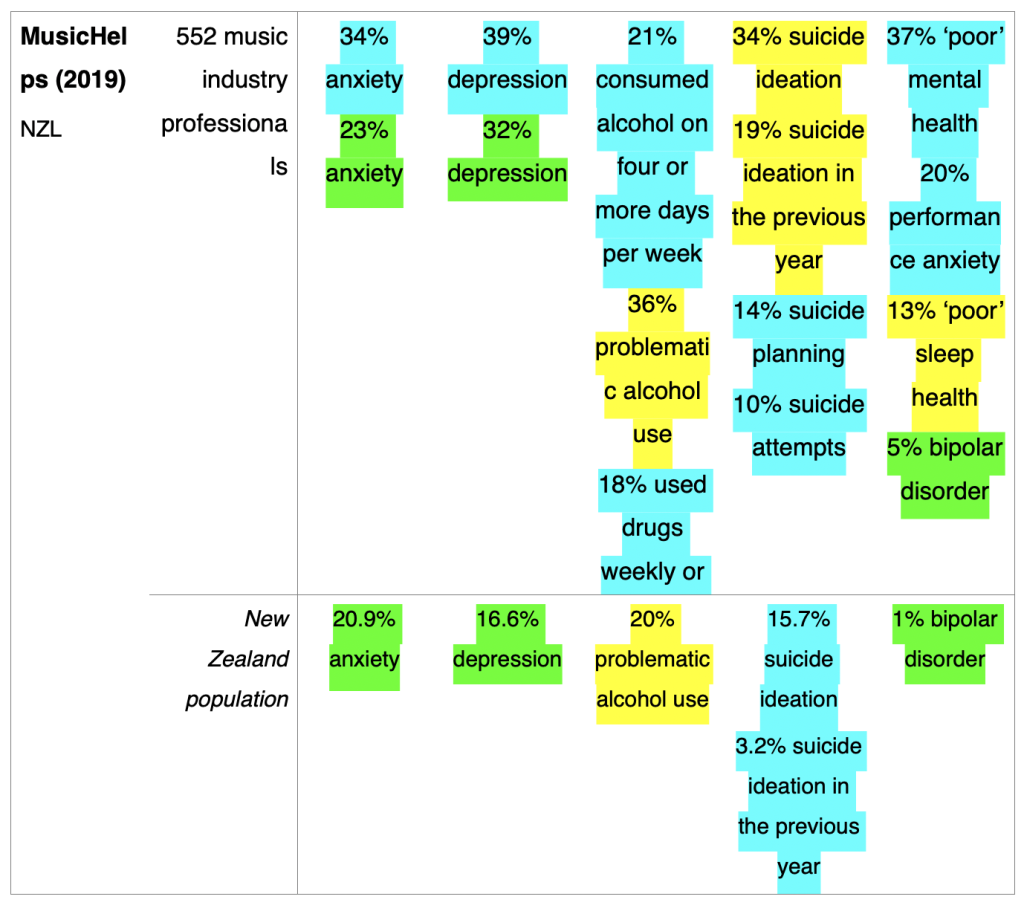
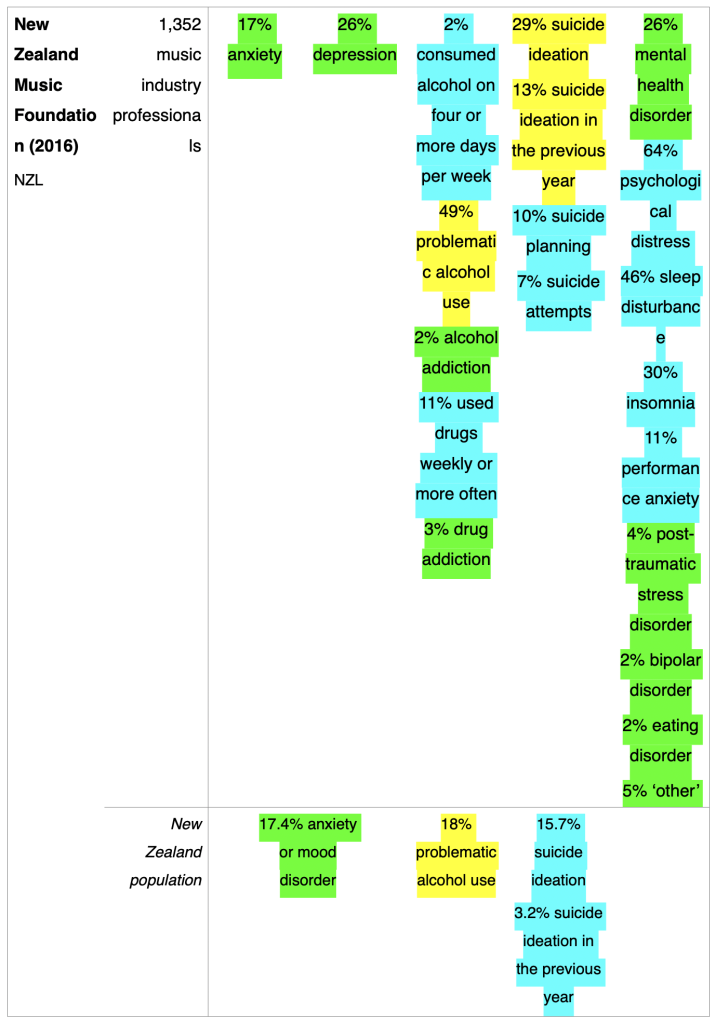
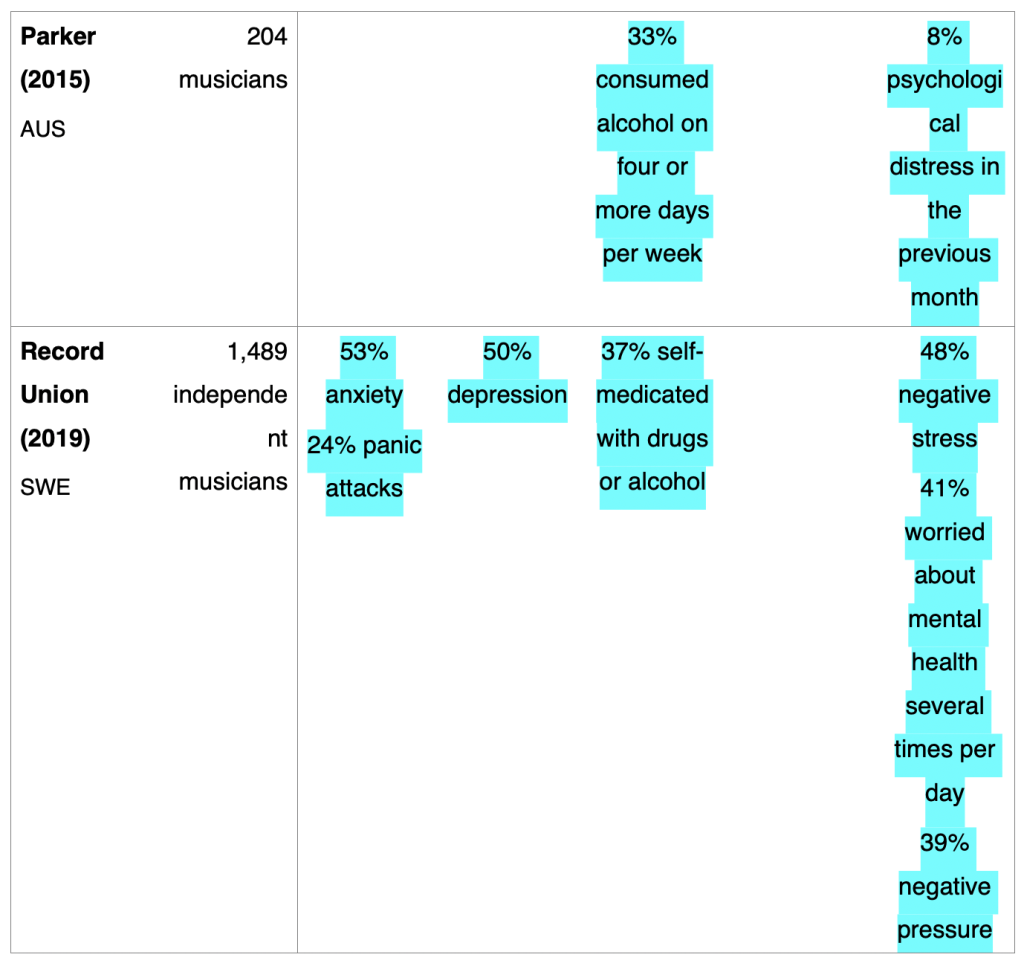
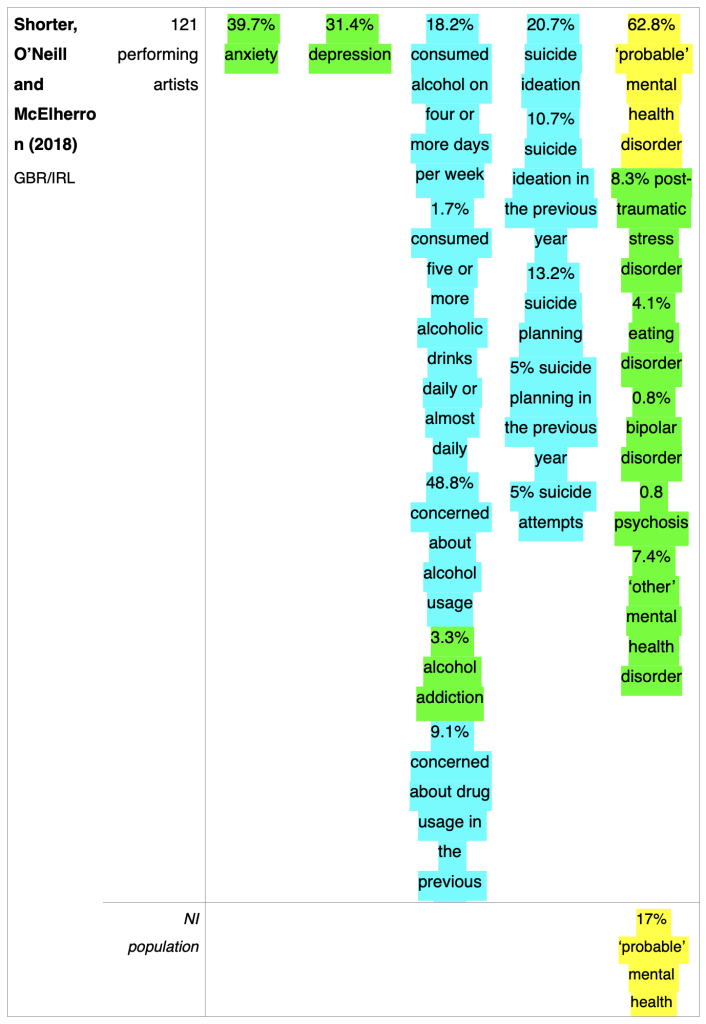
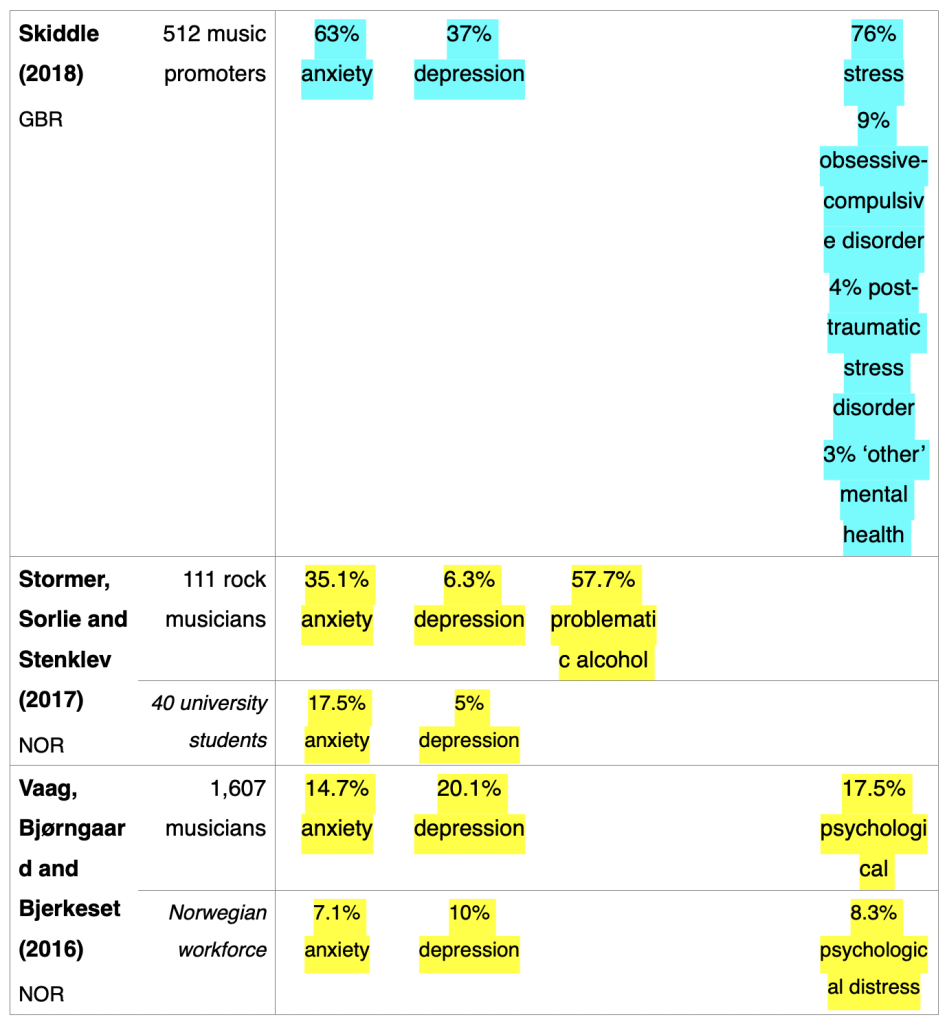
Note 1: Where possible, percentages of responses have been recalculated to percentages of whole sample.